How to establish the cost and timeframe for project delivery and how to fail fast.
Defining Scope
The scope of a project is often hard to get right as it can often change dramatically during the course of a project (especially if very detailed). However the key consideration here is to ensure that although you don’t necessarily know everything about what you will deliver you do know enough to be able to at least understand what your minimal viable product looks like. You should then be able to establish relatively quickly after starting your project that you can meet the goals of the minimum viable product with the funds that are available to you.
This is important because ultimately no change project is ever really completed (sorry stakeholders!) in that the delivered application reaches a point that no more change will ever be required to it. Instead, as an organisation is always in a state of change, so are the applications that support it. However all applications should be able to reach a level of maturity where they are supporting a business model that is generating income. At this point the future changes to the application can be based upon calculation to determine which changes are most beneficial to the business. This is when a project moves from delivery to maintenance.
Therefore when defining the scope of a project it is important to concentrate on what the application must be able to do and far less important to consider what you may like it to do in the future. These capabilities can be defined as a set of stories in a backlog. Rather than using the finer grained definition of a calculated dollar value for each story, the stories at this stage can be given a simple MoSCoW (Must, Should, Could, Would/Won’t) value. This enables the team to identify the stories that they must size, and decompose if epic, first (the Must Haves). Once this has been completed for all the ‘must have’ stories you have an understanding of what needs to be done to meet the primary requirements of the project (a total number of points needed to deliver the minimum viable product). This is not an easy task and takes discipline to complete this work but by completing this work with a small tightly focussed team you have the ability to really understand the scope of what you want to do before the meter is really running. You can also calculate the kind of velocity you will need from your iterations to be able to deliver according to the aspirations of the milestone plan.
Calculating Delivery Timescales and Costs
Once you have a total number of points required to deliver a minimum viable product then the next step is to determine the expected velocity to deliver the MVP and the cost of maintaining that velocity.
To complete this task you need to determine who will be in your backlog teams and the number and types of backlogs that you need. The simplest implementation will be for a single backlog team that will cover the entire delivery lifecycle from analysis through to release in a single iteration.
What you really want to know is if you can deliver the MVP before the money runs out. To do this you need to know two key numbers:
- The run-rate for an iteration i.e. how much it costs to complete each iteration.
- The velocity – How many points you can deliver in any iteration.
Calculating Run-rate
You can calculate the run-rate by taking the day rate for each team member and multiply by the number of days in the iteration to get the run rate for an iteration. There may also be some additional expenses to add in and these also need to be taken into account. By dividing this number by the budget for the project you can calculate how many iterations you can afford to complete.
Calculating Velocity
To calculate the velocity you need to involve the team that are delivering the iteration by asking them to estimate how many points they can deliver within an iteration. There are a number of techniques you can use for this.
One technique is to take some example user stories with a range of points and ask how many of them they feel they can fit into the iteration. By assigning them to the team members and mapping out how long each will take to complete. This technique can be fairly inaccurate. Consequently it is better to ask for a range by asking for three numbers:
- The stories that they can absolutely guarantee they can deliver.
- The stories they think that they should be able to deliver.
- The stretch stories that they will deliver if everything goes well.
By totting up the points score for each of the above stories you get a pessimistic velocity, a likely velocity and an optimistic velocity. This allows you to draw out the graph shown below for the project:
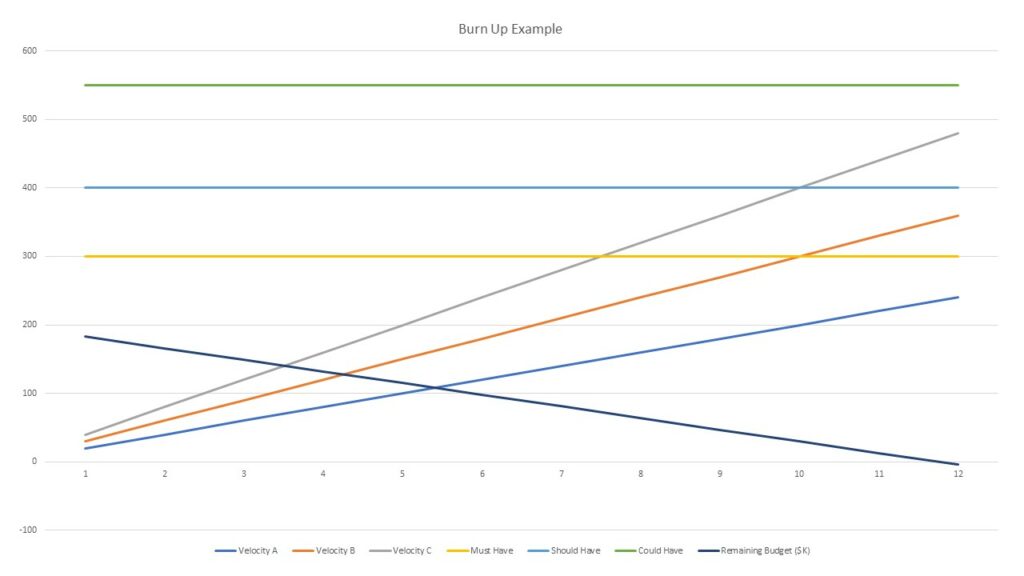
The burn up chart above illustrates the basic concepts of this technique. The remaining budget line shows the funds left over time. When the line hits zero then the budget is gone so no more iterations are possible without additional funds (This burn down chart is typically shown separately but has been added here to demonstrate the relationship with the burn up chart). In this example we can see that effectively with a bit of squeeze we can afford to complete 12 iterations. The Must have line shows the points that need to be delivered to deliver the minimum viable product. The should have line is with the addition of the should have requirements and then finally the green line illustrates where all could have requirements will be delivered as well.
The other three lines illustrate the three possible velocities that we have just calculated.
- Velocity A (Pessimistic) suggests that the project should be cancelled at this point unless additional budget can be made available as it suggests that you will not be able to deliver the minimum viable product within the available budget.
- Velocity B (Likely) suggests that the team will be able to deliver the minimum viable product and some of the should have requirements. On this basis then it would probably be ok to start the project but monitor the burn up chart closely to ensure that the team can deliver the predicted velocity. There is potential to go live in iteration 10 (where the orange line crosses the yellow line).
- Velocity C (Optimistic) suggests that the team will deliver the ‘must have’ requirements, the ‘should have’ and the ‘could have’ requirements. They may be able to go live in iteration 8 (where the grey line crosses the yellow line).
The reality will most likely be between the likely and pessimistic estimates so a decision should be made whether or not to scale the project up or cancel based on these estimates. In this example it would be reasonable to start the project as the MVP line is within the range between the likely and pessimistic estimates and agree to run for three or four iterations to identify a true velocity. Where the likely velocity will not deliver the MVP it would be best to either increase project budget or cancel the project if the business case does not support the additional budget.
This graph will also evolve through the delivery cycle as the actual delivery managed in each iteration will replace the projections. I would suggest a checkpoint at either three or four iterations as at this point the delivery process has normally settled down and you can see a true velocity for the backlog. This will give you the opportunity to take remedial action if it does not look like you will be able to complete the MVP for the available budget. The available actions are:
- Cancel the project
- Reduce the scope if it is possible to identify a reduced MVP that can be delivered to provide business benefit that will fund further development
- Increase budget if it can be supported in the business case.
This is failing fast as although it is never particularly palatable to cancel a project these two early checkpoints give you opportunities to cancel before the project expense and emotional investment becomes so large that an organisation feels that they need to continue with the project no matter what. This is where the hugely expensive failures occur.
Projects are also based on teams and technology and sometimes it is just that the technology decisions made and the team involved are not the right people to deliver the project. In this case a reset by forming a new team and considering new approaches and technologies may be able to deliver where the previous team never would.
An organisation that can effectively apply these brakes is ultimately one that will succeed as they can take greater risks with projects and approaches as they have the mechanisms in place to prevent these projects from resulting in expensive failure. Using the car analogy a car with good brakes will always get round the track faster than one without those brakes because they can deal with the inevitable corners.